CalTopo’s most useful features for backcountry travel
By Aidan Goldie
It’s no secret that trip planning is essential for ensuring a safe tour in the backcountry. Knowing the kind of terrain that you might encounter should be a critical part of your decision-making process. What type of potential encounters will you and your partners have with avalanche terrain? Based on the forecasted avalanche conditions, do those encounters fit within your own risk management framework? Enter CalTopo, the app that has become a ubiquitous resource for the backcountry skier.
With its various trip-planning capabilities, CalTopo sits just behind a shovel, beacon, and probe as a necessary tool for safe and efficient backcountry travel. Intentional consideration of these variables will dictate how your day in the mountains will unfold. Careful trip planning will mitigate some of the backcountry “unknowns” and let you focus on being in the moment.
CalTopo is a powerful resource because it can do so much. So much, in fact, that it can be overwhelming to explore all of its features. Here, a breakdown of some of the most helpful features to aid the backcountry skier in the ever-critical decision making process.
Slope Angle Shading
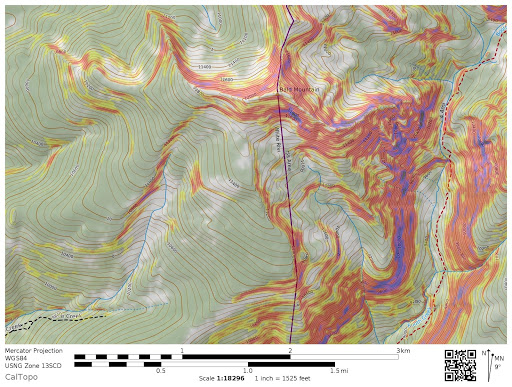
If you use CalTopo already, this is probably the feature you’re most familiar with, but beware, it’s not without its drawbacks. Slope angle is a crucial variable in avalanche dynamics and should be the first thing you consider when navigating avalanche terrain. Mitigating slope angle is effectively mitigating risk as the “danger zone” typically falls between 25° and 45°. Turning on slope angle shading can give you an approximate indication of how you should travel to minimize your exposure to that sweet spot slope angle. Try this example: how would you navigate the terrain to have a fun day out when the avalanche forecast is moderate (2)?
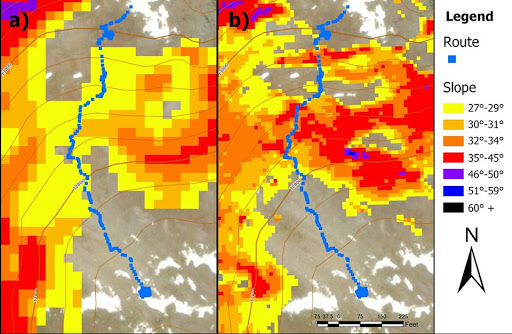
Using slope angle shading has its caveats as well. A backcountry traveler behind their computer must also consider that slope angle shading is telling an incomplete story. There isn’t enough sensitivity in the software to recognize micro-features in the terrain that can pose an avalanche hazard. In a 2019 avalanche incident report in the Upper Senator Beck Basin, CalTopo slope angle shading was cited as a possible source of error for the traveling party.
Comparing slope angle shading in CalTopo on the left in the image below to a more sophisticated GIS software using LiDar data, you can see the difference in terrain detail that could have led the party to introduce error in their trip planning. In the left image, it appears as if there is a gradual corridor to descend into the basin, where in reality there are a variety of steeper slope angles along that same track.
Ultimately, terrain is complicated and variable. While CalTopo slope angle shading can give the backcountry traveler a general picture of the expected terrain from the comforts of their home, it isn’t a substitute for informed decision-making in the field. Take a look at the full CAIC report on the Upper Senator Beck Basin Avalanche Fatality and respectfully use this case study as an opportunity to learn more through critical self-reflection.
Wind forecasting
Along with slope angle, wind should be a variable high on a backcountry traveler’s decision-making mindset. Rapidly falling snow can prove to be a dynamic force on the snowpack. Wind can deposit snow ten times faster than regular snowfall, thereby transforming a landscape and rapidly creating hazards.
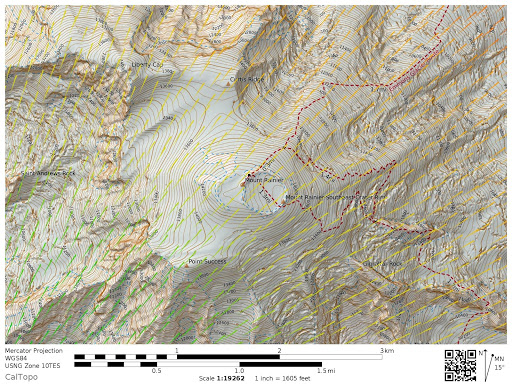
By turning on the “wind plot” feature in CalTopo, the user can see the general direction and wind speed over a period of time. I prefer to set this time interval to “24 hours” to get a general idea of the changes in the wind over the previous day. This is an important feature because it can inform what terrain could possibly be wind-scoured and conversely wind loaded. How would the above picture inform your summit day plans on Mount Rainier?
SNOWTEL data sites
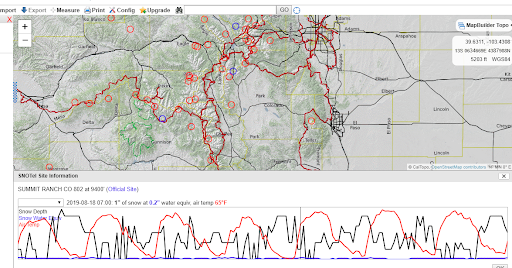
The reason why CalTopo is such a remarkable tool is that it compiles many resources into one platform, including SNOWTEL data. SNOWTEL is a series of climate sensors scattered across the United States. The 850 sensors update every hour and give measurements on snow depth, water equivalency, and air temperature. Now wouldn’t it be nice to display all of this amazing data in one place? Turn on CalTopo’s SNOWTEL layer and you will see a bunch of blue and red circles pop up on your map. Each of these circles is a SNOWTEL site and will display the snow depth at that site. See the picture for an example:
Where SNOWTEL data becomes a really powerful tool for backcountry skiing is when you click on one of those circles. This will pull up a graph of the changes in snow depth, water equivalency, and air temperature over time.
Let’s say that you are planning a spring tour of your favorite backyard mountains. Your chief concern is the possibility of wet-loose slides given the spring season. You want to ski a bigger objective but are concerned about overnight temperatures and if there was enough of a freeze to give you some mid-morning corn. You will look at temperature trends to plan your day.
Or let’s say we have received a monster storm and you want to get out on your nearby pass and ski some low-angle turns. Snow-water equivalency (SWE) is your friend. This measurement essentially will tell you how dense the snow is, or how much of the snow is made up of water. SWE of more than 1 inch, or 12 inches of new snow in 24 hours are good threshold markers of concern for avalanche hazard. While avalanche forecasters will use these measures to create a daily forecast for a zone, looking at individual SNOWTEL sites will give you more accuracy if you know how to interpret that information.
Satellite Projection
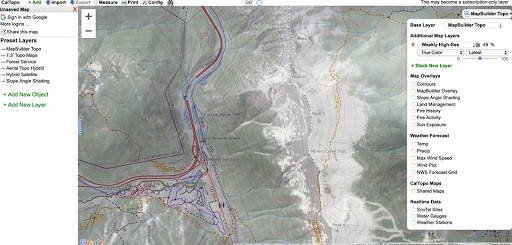
This last feature is one of CalTopo’s newest and perhaps the most useful for fringe season skiing. CalTopo has integrated satellite imagery from the Copernicus Program. This data adds low-resolution satellite imagery that can be overlayed onto your map. Essentially, it can provide daily satellite information and loosely show the snow coverage in an area. To unlock this feature you first need to open the layer “Weekly High Res”. I would suggest setting this layer as your primary layer and using false-color green, and then overlay it on the Mapbuilder Topo at 70%. Take a look at this image of the Tenmile Range I was using in preparation for some spring ski-mountaineering:
One thing you may notice is that there is significantly more snow cover on the east side of the Tenmile Range compared to the west. It also looks like some of the spring ski mountaineering lines I am eyeballing have enough coverage to ski and can be approached by skinning. This is a level of recon that I can do remotely from the comfort of my home and trust with a degree of certainty. CalTopo updates these maps every five days so I know that satellite imagery took this picture within a week of attempting my objective.
Closing Thoughts
Take advantage of the information it can provide in your trip planning, but don’t forget the importance of the information that you will gather in the field. CalTopo only adds to your pool of information and does not replace experience and education that will inform your backcountry decisions. It should also be noted that CalTopo is an incredible resource that is free for everyone to use. The developer, Matt Jacobs, has introduced a three-tiered membership structure to help fund this project. If you have enjoyed using CalTopo or want to support the developer, consider contributing as a member.
Aidan Goldie is a Vail-based backcountry skier and photographer. When he is not climbing and descending peaks in the American West, he is an outdoor educator, working with schools and nonprofits guiding groups through the Colorado wilderness. To check out more of his work visit his website: www.aidangoldie.com
Beyond our regular guest bloggers who have their own profiles, some of our one-timers end up being categorized under this generic profile. Once they do a few posts, we build a category. In any case, we sure appreciate ALL the WildSnow guest bloggers!

